How to Map a Competitor's Sale Calendar from Price History
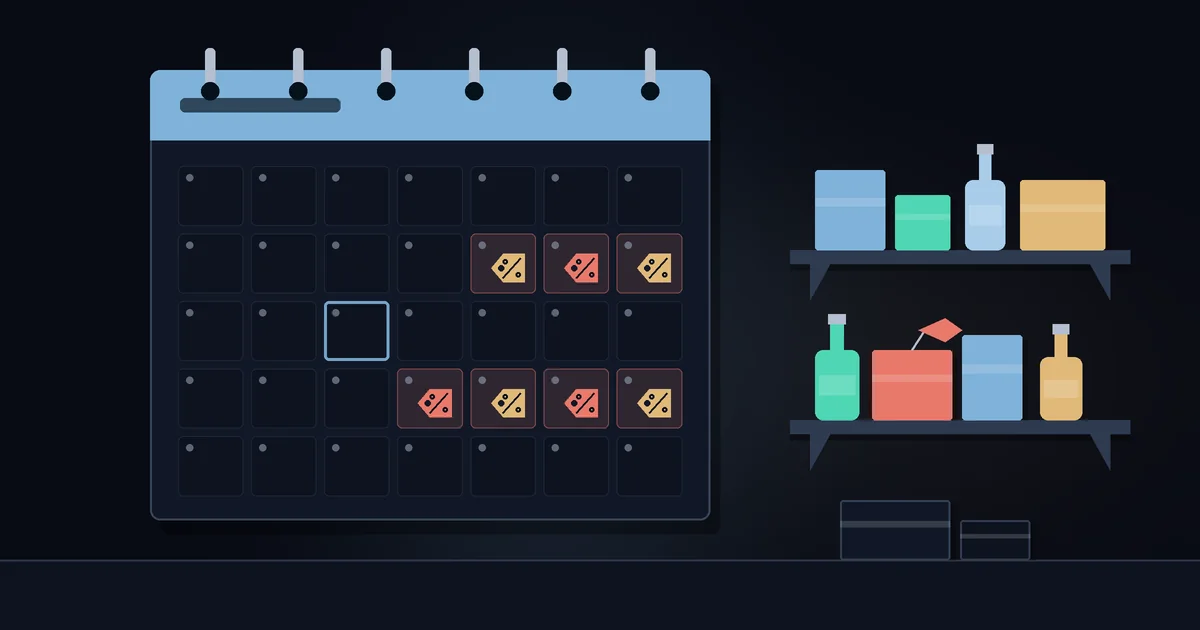
Most small Shopify competitors do not discount at random. They run sales on a rhythm: a weekend every month, a clearance push at the end of a season, a deeper cut when stock piles up. Write that rhythm down and you can plan your own promotions around theirs instead of reacting to each price drop as it happens. Below is how to build a competitor sale calendar from public catalog data, with a worked example and the places where the method stops being reliable.
What a sale calendar actually is
A sale calendar is a simple log of discount events for each competitor: when a sale started, how long it lasted, how many products it covered and how deep the cuts were. After a few months, the log shows patterns that a single snapshot never will:
- How often the competitor runs a store-wide sale.
- Whether sales last a weekend or two weeks.
- Whether they discount a handful of products or a third of the catalog.
- The typical discount, and whether it is creeping up.
- Which products drop hard and then disappear from the catalog (clearance).
You can do all of this with free data: regular snapshots of the competitor's catalog and a few rules for deciding what counts as a sale.
Step 1: collect daily snapshots
Every Shopify store exposes its public catalog at /products.json, with the current price and the compare_at_price for every variant. The products.json guide covers how to read it. The catch is that it only shows today's prices. To see a sale start and end, you have to save a copy yourself, on a schedule.
Save one every day. Many small-store sales last three or four days, and a weekly snapshot misses a lot of them. If you save one snapshot every Monday and a competitor runs a sale from Thursday to Sunday, you never see it. Other jobs can get by with less; the frequency guide covers those.
For each snapshot, keep the date, product handle, variant, price and compare_at_price. A spreadsheet with one row per product per day is enough for a store with a few hundred products.
Step 2: decide what counts as a sale
Without a rule, you end up arguing with yourself about every small price change. Two simple rules work well:
- Product on sale: the price is at least 10% below that product's usual price (the median of its last 30 days), or a compare_at_price above the current price appears that was not there before.
- Store-wide event: on the same day, at least 15% of the competitor's products go on sale. The event ends on the first day that share falls back below the threshold.
The second rule separates a real promotion from background noise, like a single product being repriced. Be careful with compare_at_price on its own: some stores keep a struck-through "was" price on products all year. The compare_at_price article explains how to tell a permanent fake discount from a real markdown. A product whose price never changes is not on sale, whatever the label says.
Step 3: log the events
Here is an example. Suppose a competitor sells outdoor gear and has 120 products. After six months (26 weeks) of daily snapshots, the store-wide events look like this:
| Month | Started on | Days | Products on sale | Typical discount |
|---|---|---|---|---|
| Month 1 | Thursday | 4 | 38 of 120 | 20% |
| Month 2 | Friday | 3 | 41 of 120 | 20% |
| Month 3 | Thursday | 4 | 44 of 120 | 25% |
| Month 4 | Thursday | 4 | 40 of 120 | 20% |
| Month 5 | Friday | 3 | 36 of 120 | 25% |
| Month 6 | Thursday | 4 | 45 of 120 | 25% |
Six events in 26 weeks, 22 sale days in total. Out of roughly 182 days, that is about 12% of the time on sale. Each event covered 30 to 38% of the catalog. The typical discount moved from 20% in the first two months to 25% in three of the last four.
Separately, the log shows seven products that dropped 35 to 40% outside any store-wide event and were removed from the catalog within two weeks. That looks like clearance of old stock, so keep those on a separate list.
Step 4: read the pattern
From that table you can say a few useful things with some confidence:
- This competitor runs one short sale a month, usually starting Thursday or Friday. You can expect the next one.
- For roughly 88% of the year, their prices are their full prices. Comparing yourself against their sale prices would make you look more expensive than you are. If you keep a competitor price index, use full prices for it and track sales separately.
- The discount is getting deeper. That can mean slow sales, excess stock, or a deliberate change in strategy. The table can't tell you which, so keep watching.
- Clearance products are a hint about what did not sell. If you carry something similar, that is useful information about demand.
Step 5: decide what to do with it
With the calendar you can decide before their next sale starts. Some options:
- Do nothing on purpose. If your products are different enough, a short competitor sale may barely affect you. Knowing it ends in four days makes it easier to hold your price. The price matching framework covers when holding is the right call.
- Move your own promotion. Running your sale on the same weekend puts you head to head on price. Running it a week earlier or later can catch shoppers they do not reach.
- Plan stock. If you expect a dip in your sales during their event, order less for that week. If their clearance list overlaps with your range, be careful about reordering the same kind of product.
- Respond with something other than price. Free shipping, a bundle or an email to past customers during their sale can protect sales without cutting margin across the board.
Where this method breaks
A catalog-based sale calendar only sees what the catalog shows. Know the gaps:
- Discount codes and cart discounts apply at checkout and leave the catalog price untouched, so your snapshots never see them.
- Email and SMS offers sent to a competitor's list stay invisible unless you are on that list.
- A flash sale that runs for a few hours can start and end between two daily snapshots.
- The catalog you read may show prices for one market or currency, and prices elsewhere can differ.
- Small samples. Six months gives you six events, enough for a working guess and no more. Seasonal patterns need at least a full year.
Doing this by hand is realistic for one or two competitors. Past that, saving daily snapshots and keeping the log up to date becomes the real work. StoreSentry keeps a price history for every tracked product and sends price-drop alerts after each check (hourly on paid plans, daily on Free), so the raw data for a sale calendar collects itself. You still have to read the pattern yourself.
Let the sale log fill itself
StoreSentry checks competitor Shopify stores on a schedule and sends a digest of price moves, launches, restocks and sell-outs by email or Telegram. Free for 2 competitors, no card required; price history and CSV export on paid plans.
Install the app — free for 2 competitors →